 Graph
Theory Lessons


 Lesson
1: Null Graphs

The simplest type of graph is a null graph. It
consists of a non-empty finite set of elements called vertices. The applet below shows some examples of null graphs.
applet 1
We shall use this exercise to introduce you to
the program Petersen
. If you decide to copy and run
this program at home you will need the executable program Petersen.exe
and the file vbrun100.dll.
Click on the Petersen icon to
start the program. After the welcome message and copyright notice you will
get a screen with two rectangles. The large one is for pictures of graphs
and the lower one will have instructions and messages. To input a null
graph, click on Graph and then Null Graph. You will get an
input box with the question "How many vertices (< 66)". The "<66"
is there to indicate that the maximum number of vertices that this program
will accept is 65. Press 4 and then press the Enter key (or
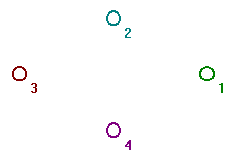
click OK.) You will get four vertices on the screen like in Fig. 1. The
N(4) at the top means Null graph on four vertices, sometimes written as
N4.

|
|
Fig. 1, The Null Graph N4
|
In a similar way try to get the null graph with
10 vertices called N10. Notice that the labels 1, 2,
3, etc. are the same color as the vertices they refer to. This will be
useful when you have many vertices on the screen. If the colors don't come
out well on your monitor you can turn the color off by clicking Picture,
Color and then Off. Try a few others like N25
and so on.
Null graphs are not very interesting so let us
introduce some edges. These will be line segments from one vertex
to another.
Two vertices v1 and v2
are adjacent if there is an edge between
them. Use the procedure outlined above and get N4 on
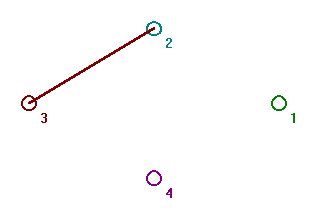
your screen as in Fig. 1. To add an edge from vertex 3 to vertex 2 you
click on vertex 3 with the right mouse button and drag to vertex 2. Your
graph should now look like Fig. 2.

|
|
Fig. 2
|
Experiment and add edges to graphs as you wish
to get used to the program. One thing you will notice is that the graphs
are simple graphs (no more than one edge between vertices and no
loops). You will also notice that the program always represents edges as
straight lines. We shall find that even with these limitations that there
are a lot of interesting things we can do. To erase an edge you do the
same thing: use the right mouse button and drag from one vertex to the
other. Sometimes you will need to store your graph on disk so let us learn
how to save and restore a graph. Get the graph N25 as
above. To save it click Graph and Save. You will get an input
box with instructions "Save as graph [1...9]". Let us save this graph as
graph 1. Press 1 and Enter. Now suppose at a later time we
want to get this graph from the disk. To restore a file you click Graph
and Restore. There are many interesting graphs so let us look at
a few of them. They can all be obtained by using the menu labeled "Graph".
Complete graphs are graphs in which every vertex is adjacent to
every other vertex. Click Graph then Complete then Complete
Graph. You will be asked how many vertices you want. Input an integer
(e.g. 5). You will then get the complete graph on 5 vertices which
we will call K5 for short. A complete bipartite
graph has the vertices in two groups (let us call them the left and right
)and all vertices in one group are adjacent to all vertices in the other.
If you click Graph then Complete then Complete Bipartite
you will be asked to input how many vertices you want on the left and on
the right. Try 4 vertices on the left and 3 on the right
to get the graph we will call K4,3. Now that you get
the idea I will not spoil the fun -- explore and ask questions if you find
anything puzzling!


 e-mail: C.
Mawata
© C. Mawata

 Lesson
1: Null Graphs
